


www.space.com
Landsat at 50: How satellites revolutionized the way we see — and protect — the natural world
Fifty years ago, U.S. scientists launched Landsat — a satellite that dramatically changed how we see the world.
Education
This article was originally published at The Conversation. (opens in new tab) The publication contributed the article to Space.com's Expert Voices: Op-Ed & Insights (opens in new tab).
Stacy Morford (opens in new tab), Associated Press national editor and state government reporter.
Fifty years ago, U.S. scientists launched a satellite that dramatically changed how we see the world.
It captured images of Earth's surface in minute detail, showing how wildfires burned landscapes, how farms erased forests, and many other ways humans were changing the face of the planet.
The first satellite in the Landsat series (opens in new tab) launched on July 23, 1972. Eight others followed, providing the same views so changes could be tracked over time, but with increasingly powerful instruments. Landsat 8 (opens in new tab) and Landsat 9 (opens in new tab) are orbiting the planet today, and NASA and the U.S. Geological Survey are planning a new Landsat mission
The images and data from these satellites are used to track deforestation and changing landscapes around the world, locate urban heat islands, and understand the impact of new river dams, among many other projects. Often, the results help communities respond to risks that may not be obvious from the ground.
Here are three examples of Landsat in action, from The Conversation’s archive.
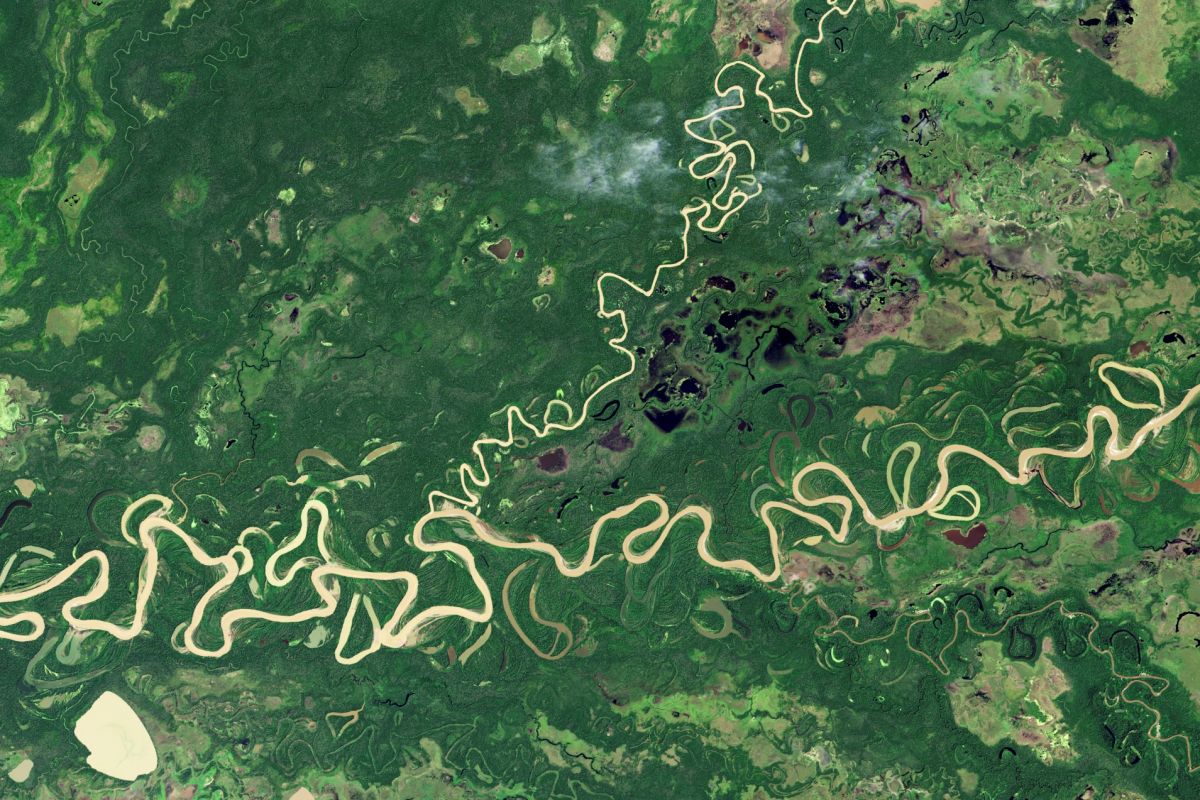
When work began on the Belo Monte Dam project in the Brazilian Amazon in 2015, Indigenous tribes living along the Big Bend of the Xingu River started noticing changes in the river's flow. The water they relied on for food and transportation was disappearing.
Upstream, a new channel would eventually divert as much as 80% of the water to the hydroelectric dam, bypassing the bend.
The consortium that runs the dam argued that there was no scientific proof that the change in water flow harmed fish.
But there is clear proof of the Belo Monte Dam project's impact — from above, write Pritam Das (opens in new tab), Faisal Hossain (opens in new tab), Hörður Helgason (opens in new tab) and Shahzaib Khan (opens in new tab) at the University of Washington. Using satellite data from the Landsat program, the team showed how the dam dramatically altered (opens in new tab) the hydrology of the river.
"As scientists who work with remote sensing, we believe satellite observations can empower populations around the world who face threats to their resources," Das and his colleagues write.
Landsat's instruments can also measure surface temperatures, allowing scientists to map heat risk street by street within cities as global temperatures rise.
"Cities are generally hotter than surrounding rural areas, but even within cities, some residential neighborhoods get dangerously warmer than others just a few miles away," writes Daniel P. Johnson (opens in new tab), who uses satellites to study the urban heat island effect at Indiana University.
Neighborhoods with more pavement and buildings and fewer trees can be 10 degrees Fahrenheit (5.5 degrees Celsius) or more, warmer than leafier neighborhoods, Johnson writes. He found that the hottest neighborhoods tend to be low-income, have majority Black or Hispanic residents and had been subjected to redlining, the discriminatory practice once used to deny loans in racial and ethnic minority communities.